> ## Documentation Index
> Fetch the complete documentation index at: https://docs.meteroid.com/llms.txt
> Use this file to discover all available pages before exploring further.
# Analytics
> Browse a catalog of ready-made metrics and chart, break down, filter, compare and forecast any of them in the explorer.
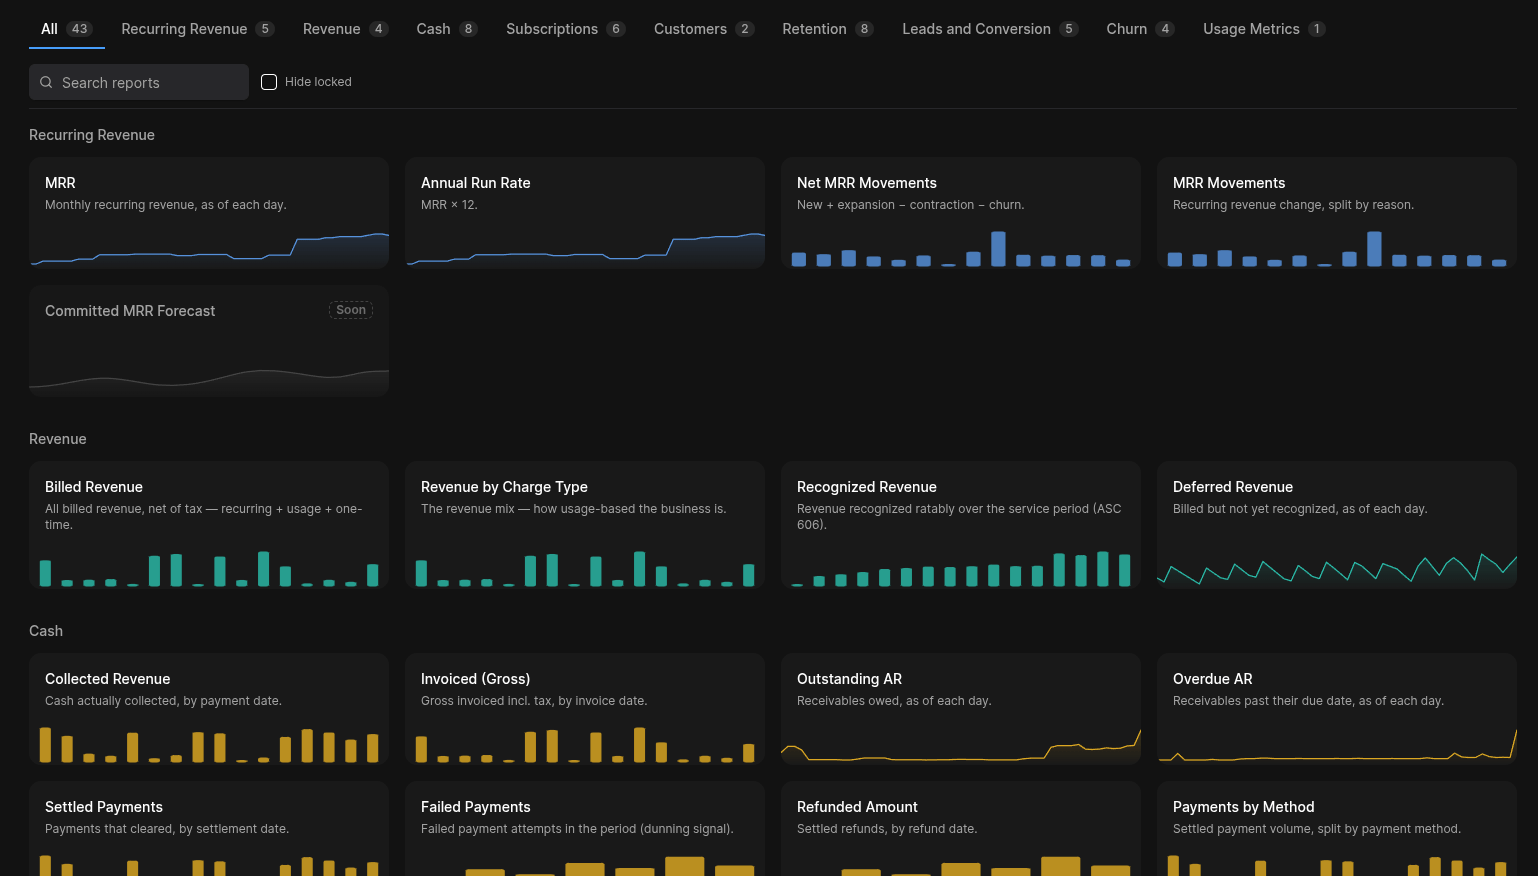 Open **Intelligence > Analytics** to reach the Reports catalog. It's organized into tabs:
* **Reports** — a searchable, categorized grid of built-in metrics, each with a live preview sparkline.
* **Custom charts** — your saved explorations.
* **Compound metrics** — build a KPI the catalog doesn't ship (see [below](#compound-metrics)).
* **Segments** — reusable customer cohorts (see [Segments](/analytics/segments)).
* **Cohort retention** — retention cohorts over time.
* **Dashboards** — composable dashboards (see [Dashboards](/analytics/dashboards)).
Toggle **Hide locked** to focus on the metrics available on your plan. Click any metric card to open it in the explorer.
## The metric catalog
Meteroid ships **34 built-in metrics** across 7 groups, plus your own usage metrics. Every metric supports a table view, and most support several visualizations and breakdowns.
### Recurring revenue
| Metric | Description |
| ----------------------------------------------------------------------- | ------------------------------------------------------------------- |
| **MRR** | Monthly recurring revenue (a stock value at each point in time). |
| **Annual Run Rate (ARR)** | MRR annualized. |
| **Net MRR Movements** | Net new MRR (new + expansion + reactivation − contraction − churn). |
| **MRR Movements** | The movement waterfall, split by movement type. |
| **New Business / Expansion / Contraction / Reactivation / Churned MRR** | The individual movement components. |
### Revenue
| Metric | Description |
| ---------------------------------------- | ------------------------------------------------------- |
| **Billed Revenue** | Revenue billed in the period. |
| **Revenue by Charge Type** | Billed revenue split into usage / recurring / one-time. |
| **Usage / Recurring / One-time Revenue** | Billed revenue by charge type, as standalone metrics. |
| **Recognized Revenue** | Revenue recognized in the period (ASC 606 style). |
| **Deferred Revenue** | Revenue billed but not yet recognized (a stock value). |
### Cash
| Metric | Description |
| ----------------------------- | ------------------------------------------------ |
| **Collected Revenue** | Cash actually collected. |
| **Invoiced (Gross)** | Total invoiced amount. |
| **Outstanding AR** | Accounts receivable outstanding (a stock value). |
| **Overdue AR** | Receivable past due (a stock value). |
| **Settled / Failed Payments** | Successful and failed payment counts/amounts. |
| **Refunded Amount** | Amount refunded. |
| **Payments by Method** | Payments split by payment method type. |
### Subscriptions
| Metric | Description |
| ------------------------------- | -------------------------------------------------- |
| **Active Subscriptions** | Live subscriptions (a stock value). |
| **New / Churned Subscriptions** | Subscriptions started and cancelled in the period. |
### Customers
| Metric | Description |
| -------------------------------------- | ------------------------------------------------------ |
| **Active Customers** | Customers with an active subscription (a stock value). |
| **Average Revenue Per Account (ARPA)** | Revenue divided by active accounts. |
### Retention
| Metric | Description |
| --------------------------------- | ----------------------------------------------- |
| **Gross MRR Churn Rate** | Churned MRR as a percentage. |
| **Gross Revenue Retention (GRR)** | Retained recurring revenue excluding expansion. |
| **Net Revenue Retention (NRR)** | Retained recurring revenue including expansion. |
| **Logo Churn Rate** | Customer (logo) churn as a percentage. |
| **Lifetime Value (LTV)** | Estimated customer lifetime value. |
| **Quick Ratio** | (New + expansion) ÷ (contraction + churn). |
### Usage metrics
Your own **billable metrics** appear here automatically. Each is an aggregation over your events—`sum`, `avg`, `min`, `max`, `count`, `count distinct` or `latest` of an event property—and can be charted, broken down and monitored like any built-in metric. See [Billable metrics](/metering/billable-metrics).
## The explorer
Opening a metric lands you in the explorer. From there you can:
A large KPI shows the current value, the period, and the change **vs. the
start of the range**, colored by whether the movement is good or bad for
that metric.
Switch between **Line**, **Area**, **Bar**, **Stacked**, **Table**,
**Breakdown** (a pivot with row totals) and **KPI**. Only visualizations
that make sense for the current metric and breakdown are offered.
Use **Break down by** to split one series into many—one per dimension value.
You can combine a **primary and a secondary** dimension (e.g. `US · pro`),
cap the primary to a **Top N** (the rest roll up into "Other"), or split
**by segment** to get one series per [saved cohort](/analytics/segments).
Add removable filter chips: **Plan**, **Product** (for revenue metrics),
**Customer**, and any enum filters the metric advertises (charge type,
movement type…). Set an **Audience** to restrict the entire chart to a
single customer segment.
Apply a **Compare** transform—running total, period-over-period delta, %
change, or moving average. Toggle **Forecast** to project a single line/area
metric 7–90 days forward with a confidence band.
**Export CSV**, **save** the exploration as a custom chart, or click **Add
monitor** to open a [Steering](/analytics/steering) alert pre-filled with
the chart's exact metric, filters and breakdown.
### Breakdown dimensions
Depending on the metric, you can break down by:
| Dimension | Notes |
| ------------------------------------------- | ----------------------------------------------------------------------------------------------------------------- |
| **Plan** | By plan. |
| **Product** | Revenue-item metrics only. |
| **Country / Currency** | From customer attributes. |
| **Customer** | One series per individual customer. |
| **Customer type** | By derived lifecycle state (paying, trialing, free, past due, churned, lead, dormant…). |
| **Movement / Charge / Payment method type** | Native breakdowns on the relevant metrics. |
| **Event properties** | For usage metrics, the distinct properties on your events are discovered automatically and offered as breakdowns. |
## Saved views
Saving an exploration persists the full state—metric, visualization, compare transform, breakdown (and secondary), Top-N, filters, split cohorts and audience—as a **Custom chart** you can reopen or drop onto a [dashboard](/analytics/dashboards). Saved charts are the building blocks for dashboards.
## Compound metrics
When the catalog doesn't ship the KPI you need, build a **compound metric**—for example revenue per account, per-unit margin, markup, or expansion ÷ churn. Open the **Compound metrics** tab.
* **Terms.** Combine up to **3** terms. Each term is a built-in catalog metric, one of your usage metrics, or a **typed constant** you enter (a cost rate, a divisor, a target). Eligible metric terms are single per-window aggregates (no breakdown).
* **Operators.** Combine terms with **÷ (ratio)**, **× (times)**, **+ (plus)** or **− (minus)**, with **explicit grouping**—`(A op B) op C` vs `A op (B op C)`—so there's no precedence guessing.
* **Format.** Choose **Auto**, **Currency** or **Number** for how the result is displayed.
* **Presets.** Start from a preset when its inputs are available: **Revenue per account**, **Expansion ÷ Churn**, or **Margin per account** (with a cost constant).
A compound metric renders through the same explorer, can be **saved** as a chart, and supports **Add monitor** so you can alert on your custom KPI.
Open **Intelligence > Analytics** to reach the Reports catalog. It's organized into tabs:
* **Reports** — a searchable, categorized grid of built-in metrics, each with a live preview sparkline.
* **Custom charts** — your saved explorations.
* **Compound metrics** — build a KPI the catalog doesn't ship (see [below](#compound-metrics)).
* **Segments** — reusable customer cohorts (see [Segments](/analytics/segments)).
* **Cohort retention** — retention cohorts over time.
* **Dashboards** — composable dashboards (see [Dashboards](/analytics/dashboards)).
Toggle **Hide locked** to focus on the metrics available on your plan. Click any metric card to open it in the explorer.
## The metric catalog
Meteroid ships **34 built-in metrics** across 7 groups, plus your own usage metrics. Every metric supports a table view, and most support several visualizations and breakdowns.
### Recurring revenue
| Metric | Description |
| ----------------------------------------------------------------------- | ------------------------------------------------------------------- |
| **MRR** | Monthly recurring revenue (a stock value at each point in time). |
| **Annual Run Rate (ARR)** | MRR annualized. |
| **Net MRR Movements** | Net new MRR (new + expansion + reactivation − contraction − churn). |
| **MRR Movements** | The movement waterfall, split by movement type. |
| **New Business / Expansion / Contraction / Reactivation / Churned MRR** | The individual movement components. |
### Revenue
| Metric | Description |
| ---------------------------------------- | ------------------------------------------------------- |
| **Billed Revenue** | Revenue billed in the period. |
| **Revenue by Charge Type** | Billed revenue split into usage / recurring / one-time. |
| **Usage / Recurring / One-time Revenue** | Billed revenue by charge type, as standalone metrics. |
| **Recognized Revenue** | Revenue recognized in the period (ASC 606 style). |
| **Deferred Revenue** | Revenue billed but not yet recognized (a stock value). |
### Cash
| Metric | Description |
| ----------------------------- | ------------------------------------------------ |
| **Collected Revenue** | Cash actually collected. |
| **Invoiced (Gross)** | Total invoiced amount. |
| **Outstanding AR** | Accounts receivable outstanding (a stock value). |
| **Overdue AR** | Receivable past due (a stock value). |
| **Settled / Failed Payments** | Successful and failed payment counts/amounts. |
| **Refunded Amount** | Amount refunded. |
| **Payments by Method** | Payments split by payment method type. |
### Subscriptions
| Metric | Description |
| ------------------------------- | -------------------------------------------------- |
| **Active Subscriptions** | Live subscriptions (a stock value). |
| **New / Churned Subscriptions** | Subscriptions started and cancelled in the period. |
### Customers
| Metric | Description |
| -------------------------------------- | ------------------------------------------------------ |
| **Active Customers** | Customers with an active subscription (a stock value). |
| **Average Revenue Per Account (ARPA)** | Revenue divided by active accounts. |
### Retention
| Metric | Description |
| --------------------------------- | ----------------------------------------------- |
| **Gross MRR Churn Rate** | Churned MRR as a percentage. |
| **Gross Revenue Retention (GRR)** | Retained recurring revenue excluding expansion. |
| **Net Revenue Retention (NRR)** | Retained recurring revenue including expansion. |
| **Logo Churn Rate** | Customer (logo) churn as a percentage. |
| **Lifetime Value (LTV)** | Estimated customer lifetime value. |
| **Quick Ratio** | (New + expansion) ÷ (contraction + churn). |
### Usage metrics
Your own **billable metrics** appear here automatically. Each is an aggregation over your events—`sum`, `avg`, `min`, `max`, `count`, `count distinct` or `latest` of an event property—and can be charted, broken down and monitored like any built-in metric. See [Billable metrics](/metering/billable-metrics).
## The explorer
Opening a metric lands you in the explorer. From there you can:
A large KPI shows the current value, the period, and the change **vs. the
start of the range**, colored by whether the movement is good or bad for
that metric.
Switch between **Line**, **Area**, **Bar**, **Stacked**, **Table**,
**Breakdown** (a pivot with row totals) and **KPI**. Only visualizations
that make sense for the current metric and breakdown are offered.
Use **Break down by** to split one series into many—one per dimension value.
You can combine a **primary and a secondary** dimension (e.g. `US · pro`),
cap the primary to a **Top N** (the rest roll up into "Other"), or split
**by segment** to get one series per [saved cohort](/analytics/segments).
Add removable filter chips: **Plan**, **Product** (for revenue metrics),
**Customer**, and any enum filters the metric advertises (charge type,
movement type…). Set an **Audience** to restrict the entire chart to a
single customer segment.
Apply a **Compare** transform—running total, period-over-period delta, %
change, or moving average. Toggle **Forecast** to project a single line/area
metric 7–90 days forward with a confidence band.
**Export CSV**, **save** the exploration as a custom chart, or click **Add
monitor** to open a [Steering](/analytics/steering) alert pre-filled with
the chart's exact metric, filters and breakdown.
### Breakdown dimensions
Depending on the metric, you can break down by:
| Dimension | Notes |
| ------------------------------------------- | ----------------------------------------------------------------------------------------------------------------- |
| **Plan** | By plan. |
| **Product** | Revenue-item metrics only. |
| **Country / Currency** | From customer attributes. |
| **Customer** | One series per individual customer. |
| **Customer type** | By derived lifecycle state (paying, trialing, free, past due, churned, lead, dormant…). |
| **Movement / Charge / Payment method type** | Native breakdowns on the relevant metrics. |
| **Event properties** | For usage metrics, the distinct properties on your events are discovered automatically and offered as breakdowns. |
## Saved views
Saving an exploration persists the full state—metric, visualization, compare transform, breakdown (and secondary), Top-N, filters, split cohorts and audience—as a **Custom chart** you can reopen or drop onto a [dashboard](/analytics/dashboards). Saved charts are the building blocks for dashboards.
## Compound metrics
When the catalog doesn't ship the KPI you need, build a **compound metric**—for example revenue per account, per-unit margin, markup, or expansion ÷ churn. Open the **Compound metrics** tab.
* **Terms.** Combine up to **3** terms. Each term is a built-in catalog metric, one of your usage metrics, or a **typed constant** you enter (a cost rate, a divisor, a target). Eligible metric terms are single per-window aggregates (no breakdown).
* **Operators.** Combine terms with **÷ (ratio)**, **× (times)**, **+ (plus)** or **− (minus)**, with **explicit grouping**—`(A op B) op C` vs `A op (B op C)`—so there's no precedence guessing.
* **Format.** Choose **Auto**, **Currency** or **Number** for how the result is displayed.
* **Presets.** Start from a preset when its inputs are available: **Revenue per account**, **Expansion ÷ Churn**, or **Margin per account** (with a cost constant).
A compound metric renders through the same explorer, can be **saved** as a chart, and supports **Add monitor** so you can alert on your custom KPI.