> ## Documentation Index
> Fetch the complete documentation index at: https://docs.meteroid.com/llms.txt
> Use this file to discover all available pages before exploring further.
# Steering
> Watch your business KPIs with metric monitors and get alerted on thresholds, % changes, anomalies, limits and forecasts.
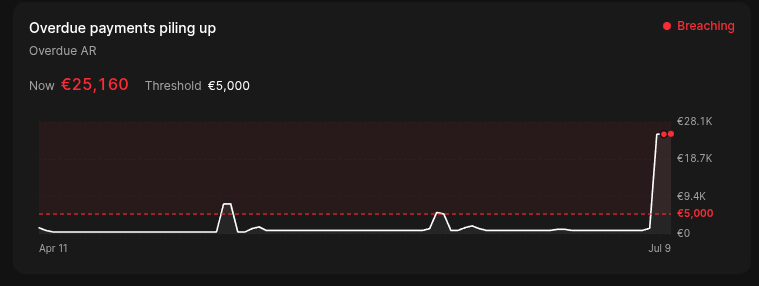 **Steering** (**Intelligence > Steering**) is where you keep an eye on the metrics that matter. It has two tabs:
* **Monitors** — the rules you've set up, each watching one metric.
* **Alerts** — the feed of everything those rules have fired, with acknowledge/resolve.
A monitor watches a **metric**; a [signal](/analytics/customer-signals) watches a **customer segment**. Both are created from the same dialog—the difference is what you're watching and where it shows up.
## Creating a monitor
Click **New monitor** on the Steering page, or use **Add monitor** in the [explorer](/analytics/reports#the-explorer) to start from the exact chart you're looking at (metric, filters and breakdown are carried over).
A monitor has:
* **Metric** — any catalog metric, one of your usage metrics, or a [compound metric](/analytics/reports#compound-metrics).
* **Split by** *(optional)* — evaluate **per segment**: fire when *any* breakdown value breaches, not just the total. The alert names the worst breaching segment (e.g. `country=US, plan=pro`).
* **Customer segment** *(optional)* — scope the whole monitor to a [segment](/analytics/segments).
* **Condition** — see the condition types below.
* **Severity** — Info, Warning or Critical.
* **Window** — the evaluation bucket: Daily, Hourly, or Per-minute.
* **Deliver to** — in-app (always on) plus any [notification channels](#notification-channels) you've configured.
Money thresholds are entered in your reporting currency's major units (e.g.
dollars, not cents). Meteroid scales them for you.
## Condition types
| Condition | Fires when… | Options |
| ------------------- | ------------------------------------------------------------ | -------------------------------------------------------------------------------------------------------------------- |
| **Threshold** | The value crosses a fixed number. | Comparator (`>`, `≥`, `<`, `≤`), value, and **"for N windows"** to require the breach to persist. |
| **% change** | The value moves too much versus the previous window. | Comparator and a percentage. |
| **Anomaly** | The value deviates statistically from its recent trend. | Sensitivity and a direction—**Spike**, **Dip**, or **Both**. |
| **Limit** | Usage approaches or crosses a cap. | A **hard limit** (fires Critical) with an optional **soft** warning band (fires Warning) at a fraction of the limit. |
| **Forecast breach** | The value is *projected* to cross a target within a horizon. | Comparator, target and horizon—fires **before** the breach actually happens. |
For threshold and limit conditions on non-currency metrics, a **suggest** button proposes a starting value based on the recent P95 of the series.
## The alerts feed
The **Alerts** tab lists fired events, filterable by **all / signals / monitors / firing**. Each event shows the rule, the condition that tripped, the severity, and the segment (for per-segment monitors). Events move through **Firing → Acknowledged → Resolved**; click **Acknowledge** to mark that you're on it.
Per-customer signal events collapse into a single incident per rule and window, so a churn-risk signal reads as *"flagged 12 customers · Acme, Globex, +9 more · \$X MRR at risk"* rather than twelve separate rows.
## Notification channels
Beyond in-app alerts, monitors can deliver to reusable channels you configure once in **Settings > Developers > Notifications**:
* **Email**
* **Slack**
* **Discord**
* **Webhook**
Configure the channel there, then pick it under **Deliver to** on any monitor or signal.
**Steering** (**Intelligence > Steering**) is where you keep an eye on the metrics that matter. It has two tabs:
* **Monitors** — the rules you've set up, each watching one metric.
* **Alerts** — the feed of everything those rules have fired, with acknowledge/resolve.
A monitor watches a **metric**; a [signal](/analytics/customer-signals) watches a **customer segment**. Both are created from the same dialog—the difference is what you're watching and where it shows up.
## Creating a monitor
Click **New monitor** on the Steering page, or use **Add monitor** in the [explorer](/analytics/reports#the-explorer) to start from the exact chart you're looking at (metric, filters and breakdown are carried over).
A monitor has:
* **Metric** — any catalog metric, one of your usage metrics, or a [compound metric](/analytics/reports#compound-metrics).
* **Split by** *(optional)* — evaluate **per segment**: fire when *any* breakdown value breaches, not just the total. The alert names the worst breaching segment (e.g. `country=US, plan=pro`).
* **Customer segment** *(optional)* — scope the whole monitor to a [segment](/analytics/segments).
* **Condition** — see the condition types below.
* **Severity** — Info, Warning or Critical.
* **Window** — the evaluation bucket: Daily, Hourly, or Per-minute.
* **Deliver to** — in-app (always on) plus any [notification channels](#notification-channels) you've configured.
Money thresholds are entered in your reporting currency's major units (e.g.
dollars, not cents). Meteroid scales them for you.
## Condition types
| Condition | Fires when… | Options |
| ------------------- | ------------------------------------------------------------ | -------------------------------------------------------------------------------------------------------------------- |
| **Threshold** | The value crosses a fixed number. | Comparator (`>`, `≥`, `<`, `≤`), value, and **"for N windows"** to require the breach to persist. |
| **% change** | The value moves too much versus the previous window. | Comparator and a percentage. |
| **Anomaly** | The value deviates statistically from its recent trend. | Sensitivity and a direction—**Spike**, **Dip**, or **Both**. |
| **Limit** | Usage approaches or crosses a cap. | A **hard limit** (fires Critical) with an optional **soft** warning band (fires Warning) at a fraction of the limit. |
| **Forecast breach** | The value is *projected* to cross a target within a horizon. | Comparator, target and horizon—fires **before** the breach actually happens. |
For threshold and limit conditions on non-currency metrics, a **suggest** button proposes a starting value based on the recent P95 of the series.
## The alerts feed
The **Alerts** tab lists fired events, filterable by **all / signals / monitors / firing**. Each event shows the rule, the condition that tripped, the severity, and the segment (for per-segment monitors). Events move through **Firing → Acknowledged → Resolved**; click **Acknowledge** to mark that you're on it.
Per-customer signal events collapse into a single incident per rule and window, so a churn-risk signal reads as *"flagged 12 customers · Acme, Globex, +9 more · \$X MRR at risk"* rather than twelve separate rows.
## Notification channels
Beyond in-app alerts, monitors can deliver to reusable channels you configure once in **Settings > Developers > Notifications**:
* **Email**
* **Slack**
* **Discord**
* **Webhook**
Configure the channel there, then pick it under **Deliver to** on any monitor or signal.