

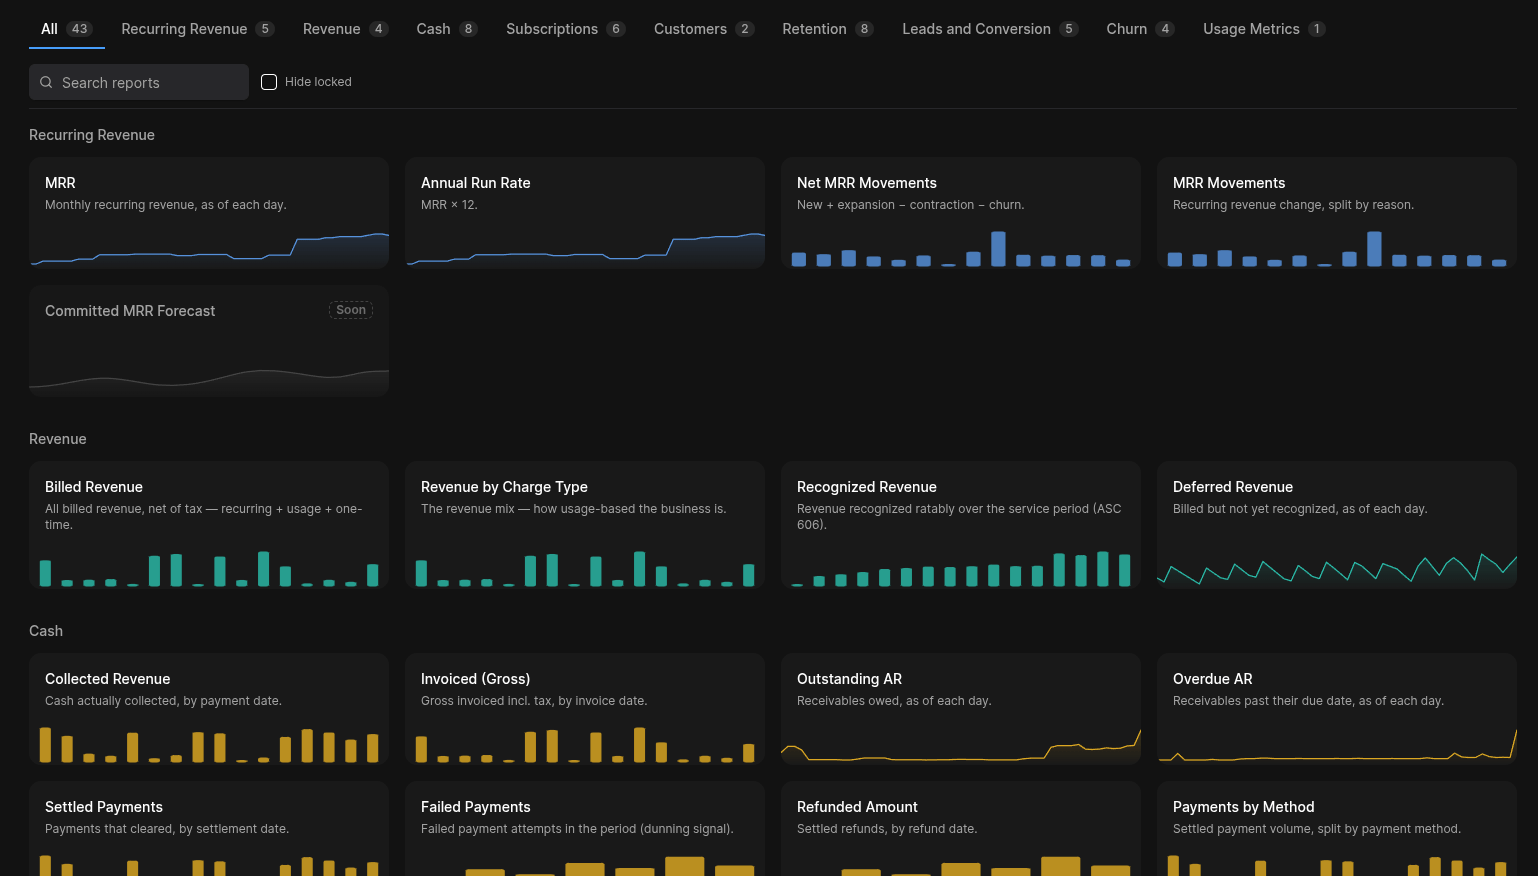
- Reports — a searchable, categorized grid of built-in metrics, each with a live preview sparkline.
- Custom charts — your saved explorations.
- Compound metrics — build a KPI the catalog doesn’t ship (see below).
- Segments — reusable customer cohorts (see Segments).
- Cohort retention — retention cohorts over time.
- Dashboards — composable dashboards (see Dashboards).
The metric catalog
Meteroid ships 34 built-in metrics across 7 groups, plus your own usage metrics. Every metric supports a table view, and most support several visualizations and breakdowns.Recurring revenue
Revenue
Cash
Subscriptions
Customers
Retention
Usage metrics
Your own billable metrics appear here automatically. Each is an aggregation over your events—sum, avg, min, max, count, count distinct or latest of an event property—and can be charted, broken down and monitored like any built-in metric. See Billable metrics.
The explorer
Opening a metric lands you in the explorer. From there you can:1
Read the headline
A large KPI shows the current value, the period, and the change vs. the
start of the range, colored by whether the movement is good or bad for
that metric.
2
Choose a visualization
Switch between Line, Area, Bar, Stacked, Table,
Breakdown (a pivot with row totals) and KPI. Only visualizations
that make sense for the current metric and breakdown are offered.
3
Break down by a dimension or segment
Use Break down by to split one series into many—one per dimension value.
You can combine a primary and a secondary dimension (e.g.
US · pro),
cap the primary to a Top N (the rest roll up into “Other”), or split
by segment to get one series per saved cohort.4
Filter
Add removable filter chips: Plan, Product (for revenue metrics),
Customer, and any enum filters the metric advertises (charge type,
movement type…). Set an Audience to restrict the entire chart to a
single customer segment.
5
Transform & forecast
Apply a Compare transform—running total, period-over-period delta, %
change, or moving average. Toggle Forecast to project a single line/area
metric 7–90 days forward with a confidence band.
6
Save or export
Export CSV, save the exploration as a custom chart, or click Add
monitor to open a Steering alert pre-filled with
the chart’s exact metric, filters and breakdown.
Breakdown dimensions
Depending on the metric, you can break down by:Saved views
Saving an exploration persists the full state—metric, visualization, compare transform, breakdown (and secondary), Top-N, filters, split cohorts and audience—as a Custom chart you can reopen or drop onto a dashboard. Saved charts are the building blocks for dashboards.Compound metrics
When the catalog doesn’t ship the KPI you need, build a compound metric—for example revenue per account, per-unit margin, markup, or expansion ÷ churn. Open the Compound metrics tab.- Terms. Combine up to 3 terms. Each term is a built-in catalog metric, one of your usage metrics, or a typed constant you enter (a cost rate, a divisor, a target). Eligible metric terms are single per-window aggregates (no breakdown).
- Operators. Combine terms with ÷ (ratio), × (times), + (plus) or − (minus), with explicit grouping—
(A op B) op CvsA op (B op C)—so there’s no precedence guessing. - Format. Choose Auto, Currency or Number for how the result is displayed.
- Presets. Start from a preset when its inputs are available: Revenue per account, Expansion ÷ Churn, or Margin per account (with a cost constant).