

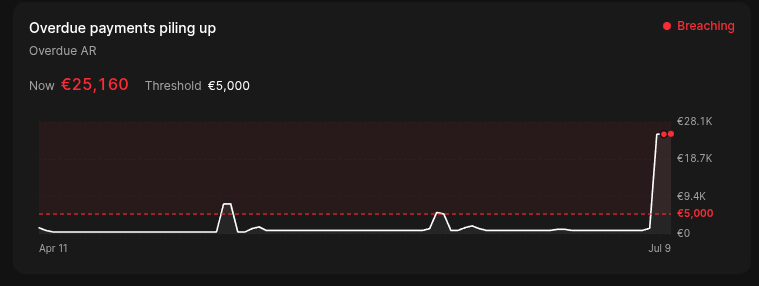
- Monitors — the rules you’ve set up, each watching one metric.
- Alerts — the feed of everything those rules have fired, with acknowledge/resolve.
Creating a monitor
Click New monitor on the Steering page, or use Add monitor in the explorer to start from the exact chart you’re looking at (metric, filters and breakdown are carried over). A monitor has:- Metric — any catalog metric, one of your usage metrics, or a compound metric.
- Split by (optional) — evaluate per segment: fire when any breakdown value breaches, not just the total. The alert names the worst breaching segment (e.g.
country=US, plan=pro). - Customer segment (optional) — scope the whole monitor to a segment.
- Condition — see the condition types below.
- Severity — Info, Warning or Critical.
- Window — the evaluation bucket: Daily, Hourly, or Per-minute.
- Deliver to — in-app (always on) plus any notification channels you’ve configured.
Money thresholds are entered in your reporting currency’s major units (e.g.
dollars, not cents). Meteroid scales them for you.
Condition types
For threshold and limit conditions on non-currency metrics, a suggest button proposes a starting value based on the recent P95 of the series.
The alerts feed
The Alerts tab lists fired events, filterable by all / signals / monitors / firing. Each event shows the rule, the condition that tripped, the severity, and the segment (for per-segment monitors). Events move through Firing → Acknowledged → Resolved; click Acknowledge to mark that you’re on it. Per-customer signal events collapse into a single incident per rule and window, so a churn-risk signal reads as “flagged 12 customers · Acme, Globex, +9 more · $X MRR at risk” rather than twelve separate rows.Notification channels
Beyond in-app alerts, monitors can deliver to reusable channels you configure once in Settings > Developers > Notifications:- Slack
- Discord
- Webhook